Thermography · August 20, 2026 · 6 min read
Infrared Thermography Inspection: What It Catches Before Failure
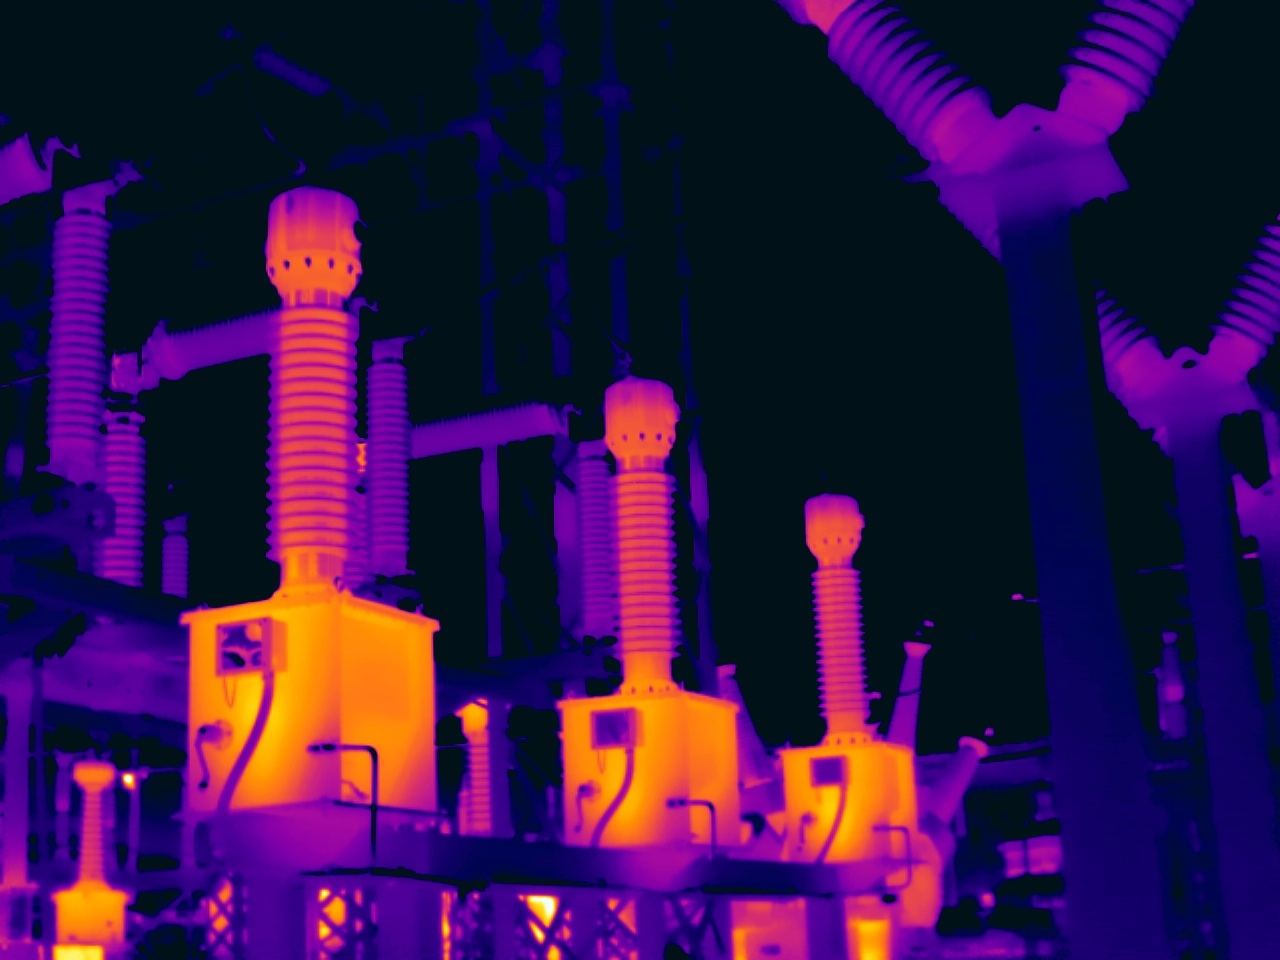
When equipment fails, the warning signs were usually present long before, you just couldn't see them. Infrared thermography is a predictive maintenance tool that reveals those hidden warning signs, finding faults before they cause unscheduled downtime or escalate repair costs. It takes the invisible and makes it visible.
What thermography does
Infrared thermography uses a thermal imaging camera to capture the heat signature of electrical and mechanical equipment in real time. Because friction, resistance, and electrical faults generate excess heat before they cause visible failure, a thermal scan can reveal developing problems long before they show up as downtime, a tripped breaker, or a failed component.
Common issues thermography detects
- Electrical hotspots and loose connections: pinpointing the exact connection running hotter than expected.
- Mechanical friction and bearing wear: identifying bearings, couplings, motors and gearboxes that are overheating due to wear, lubrication loss or contamination.
- Overloads and imbalance: showing components stressed by excessive current or uneven loading.
A typical inspection scans panels, switchgear, motors, couplings, bearings and other equipment under normal operating load, so no downtime is required. Monthly inspections that track temperature trends are the most effective at predicting pending failures. Annual scans are a common baseline for general equipment, with more frequent scans for critical or compliance-driven assets.
Why load data matters
Thermography shows where heat is occurring, but knowing the electrical load at the time of the scan is essential to interpret that heat correctly. Power loss at a compromised connection follows:
P = I²R
Because heating scales with the square of the current, even modest increases in current can produce disproportionately large increases in temperature at a high-resistance connection. That nonlinear behavior is why it is critical to record voltage and current during each scan and to assess the probability that circuit current will increase under normal or peak operating conditions.
Real world example
During a thermography inspection of a 115 kV high yard at a large paper mill, several hotspots were found on the 115 kV side of the circuit. One connection was especially critical: it carried power directly from the turbine generator to both the local utility and the mill. If that feed failed, the mill could not balance the system and would shut down abruptly, with estimated losses of $250,000 to $500,000.
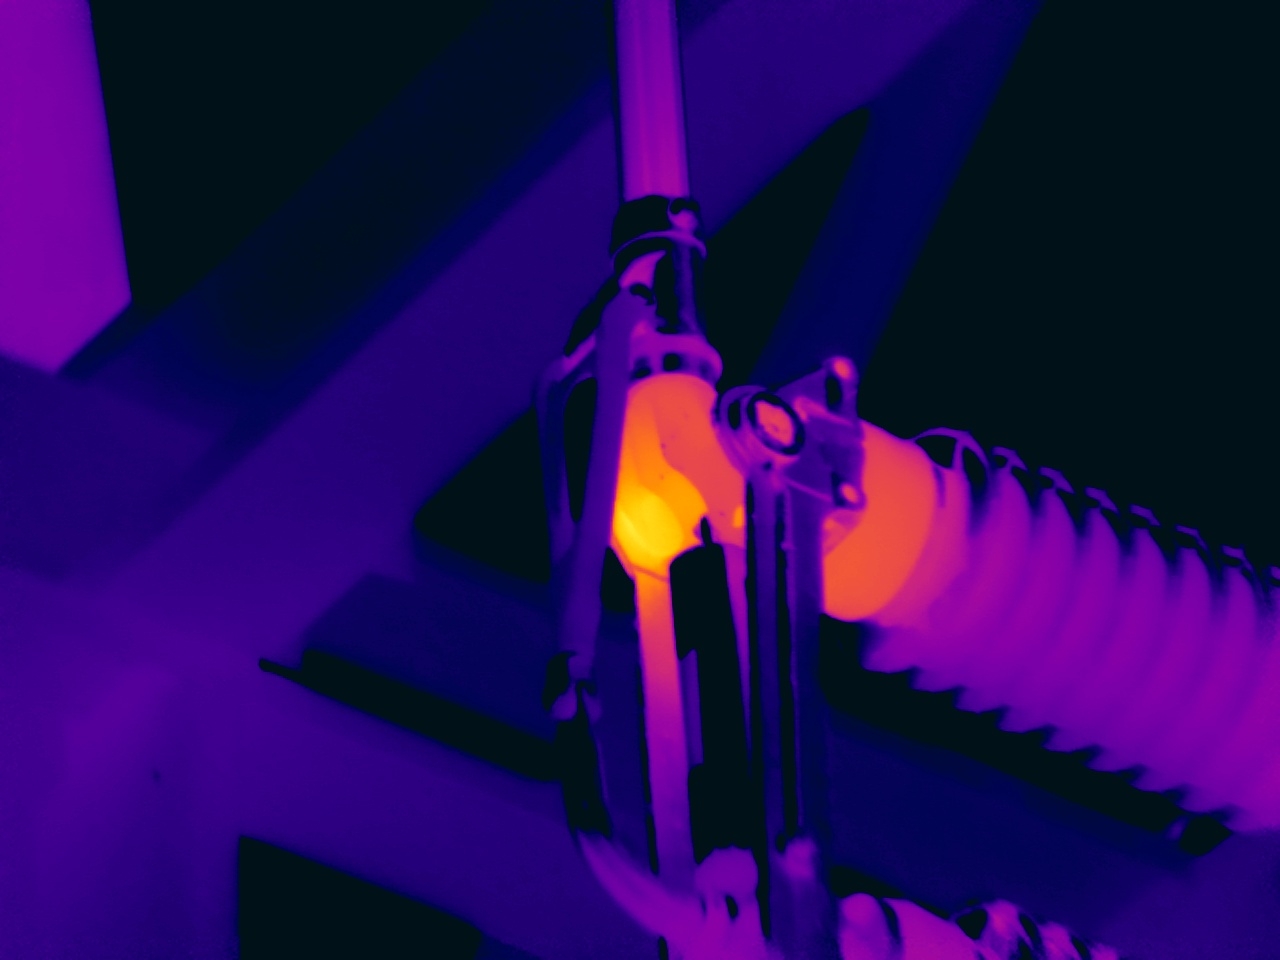
At the time of the inspection the turbine was operating at 60% of maximum output. Because heating follows P = I²R, the connection could have become dramatically hotter if the turbine pushed more power to the grid. The thermogram, captured with high-resolution optics from about 25 feet above ground, clearly identified the hot connection and provided the detail maintenance and engineering needed to prioritize corrective action.
How to use thermography results
When a hotspot is identified, a useful report should include:
- Thermal images with annotated temperature readings.
- Measured voltage and current at the time of the scan.
- Severity and risk assessment that combines probability of current increase with consequence of failure.
- Recommended next steps: monitor, schedule repair, reduce load, or immediate outage.
- Parts and labor estimates and a re-scan plan to verify mitigation.
Integrating thermography with other predictive methods, such as ultrasound for partial discharge and bearing noise and oil analysis for internal wear, gives a more complete picture and reduces the chance of missing non-heat-driven failure modes.
Recommended inspection cadence and next steps
- Baseline full scan: annually for most facilities.
- Critical systems: quarterly or monthly trend scans.
- High-risk or aging infrastructure: increase frequency and add targeted monitoring.
- When a critical hotspot is found: record load data, assess probability of increased current, prioritize repairs based on risk, and re-scan after mitigation.
Thermography turns invisible warning signs into proactive repairs. Capture the heat signature, record the load, quantify the risk, and act before a preventable failure becomes an expensive outage. Learn more about our thermography services.